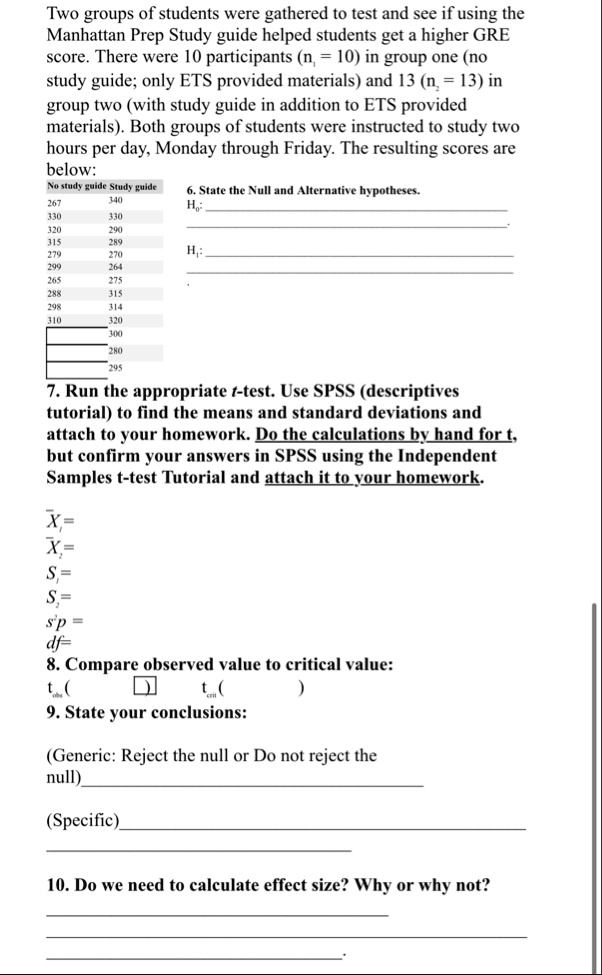
Two groups of students were gathered to test and see if using the
Manhattan Prep Study guide helped students get a higher GRE
score. There were 10 participants (n = 10) in group one (no
study guide; only ETS provided materials) and 13 (n = 13) in
group two (with study guide in addition to ETS provided
materials). Both groups of students were instructed to study two
hours per day, Monday through Friday. The resulting scores are
below:
No study guide Study guide
6. State the Null and Alternative hypotheses.
$H_0$:
267 340
330 330
320 290
315 289
279 270
$H_1$:
299 264
265 275
288 315
298 314
310 320
300
280
295
7. Run the appropriate t-test. Use SPSS (descriptives
tutorial) to find the means and standard deviations and
attach to your homework. Do the calculations by hand for t,
but confirm your answers in SPSS using the Independent
Samples t-test Tutorial and attach it to your homework.
$\bar{X_1}$=
$\bar{X_2}$=
$S_1$=
$S_2$=
$s^p$ =
$df$=
8. Compare observed value to critical value:
$t_{obs}$ ( ) $\Box$ $t_{crit}$ ( )
9. State your conclusions:
(Generic: Reject the null or Do not reject the
null)
(Specific)
10. Do we need to calculate effect size? Why or why not?