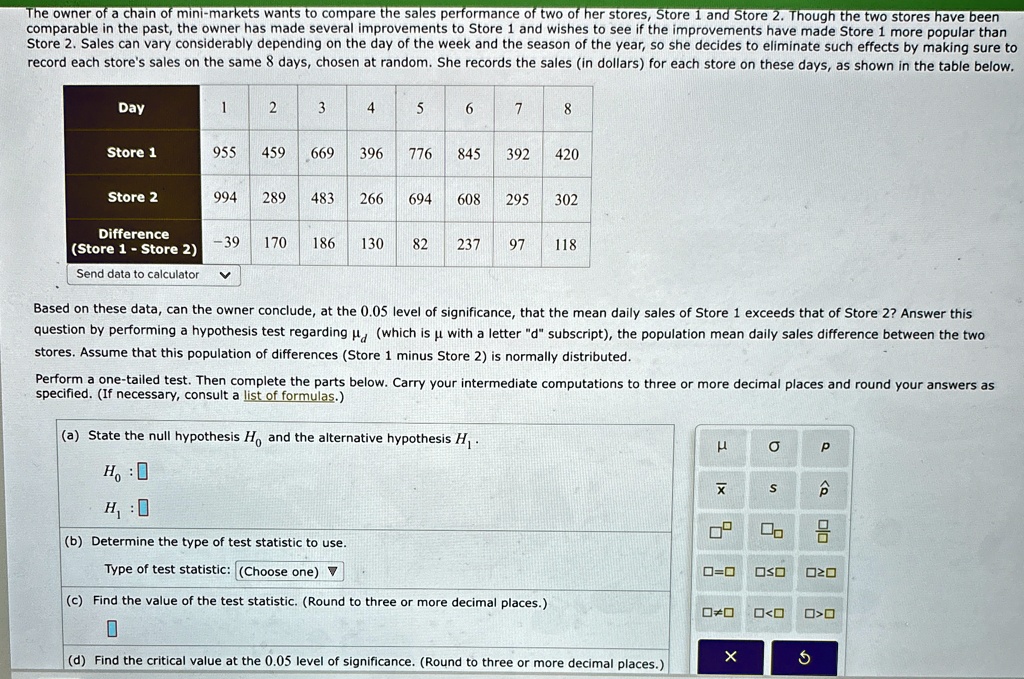
The owner of a chain of mini-markets wants to compare the sales performance of two of her stores, Store 1 and Store 2. Though the two stores have been comparable in the past, the owner has made several improvements to Store 1 and wishes to see if the improvements have made Store 1 more popular than Store 2. Sales can vary considerably depending on the day of the week and the season of the year, so she decides to eliminate such effects by making sure to record each store's sales on the same 8 days, chosen at random. She records the sales (in dollars) for each store on these days, as shown in the table below.
Day
1
2
3
4
5
6
7
8
Store 1
955 459 669 396 776 845 392 420
Store 2
994 289 483 266 694 608 295 302
Difference
(Store 1 - Store 2)
-39 170 186 130 82 237 97 118
Send data to calculator
Based on these data, can the owner conclude, at the 0.05 level of significance, that the mean daily sales of Store 1 exceeds that of Store 2? Answer this question by performing a hypothesis test regarding $\mu_d$ (which is $\mu$ with a letter "d" subscript), the population mean daily sales difference between the two stores. Assume that this population of differences (Store 1 minus Store 2) is normally distributed.
Perform a one-tailed test. Then complete the parts below. Carry your intermediate computations to three or more decimal places and round your answers as specified. (If necessary, consult a list of formulas.)
(a) State the null hypothesis $H_0$ and the alternative hypothesis $H_1$.
$H_0$:
$H_1$:
(b) Determine the type of test statistic to use.
Type of test statistic: (Choose one)
(c) Find the value of the test statistic. (Round to three or more decimal places.)
(d) Find the critical value at the 0.05 level of significance. (Round to three or more decimal places.)