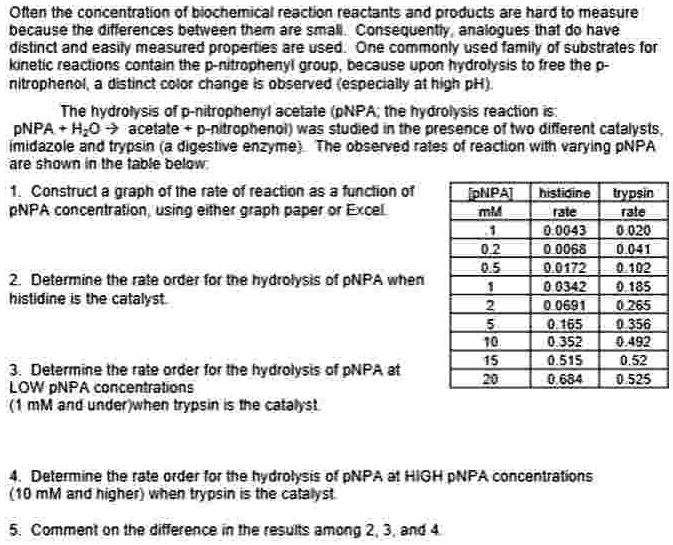
Often the concentration of biochemical reaction reactants and products are hard to measure because the differences between them are small. Consequently, analogues that do have distinct and easily measured properties are used. One commonly used family of substrates for kinetic reactions contain the p-nitrophenyl group, because upon hydrolysis to free the p-nitrophenol, a distinct color change is observed (especially at high pH).
The hydrolysis of p-nitrophenyl acetate (pNPA; the hydrolysis reaction is:
PNPA + H₂O → acetate + p-nitrophenol) was studied in the presence of two different catalysts, imidazole and trypsin (a digestive enzyme). The observed rates of reaction with varying pNPA are shown in the table below.
1. Construct a graph of the rate of reaction as a function of pNPA concentration, using either graph paper or Excel.
| pNPA | histidine | trypsin |
|---|---|---|
| mM | rate | rate |
| 0.1 | 0.0043 | 0.020 |
| 0.2 | 0.0068 | 0.041 |
| 0.5 | 0.0172 | 0.102 |
| 1 | 0.0342 | 0.185 |
| 2 | 0.0691 | 0.265 |
| 5 | 0.165 | 0.356 |
| 10 | 0.352 | 0.492 |
| 15 | 0.515 | 0.52 |
| 20 | 0.684 | 0.525 |
2. Determine the rate order for the hydrolysis of pNPA when histidine is the catalyst.
3. Determine the rate order for the hydrolysis of pNPA at LOW pNPA concentrations (1 mM and under) when trypsin is the catalyst.
4. Determine the rate order for the hydrolysis of pNPA at HIGH pNPA concentrations (10 mM and higher) when trypsin is the catalyst.
5. Comment on the difference in the results among 2, 3, and 4.