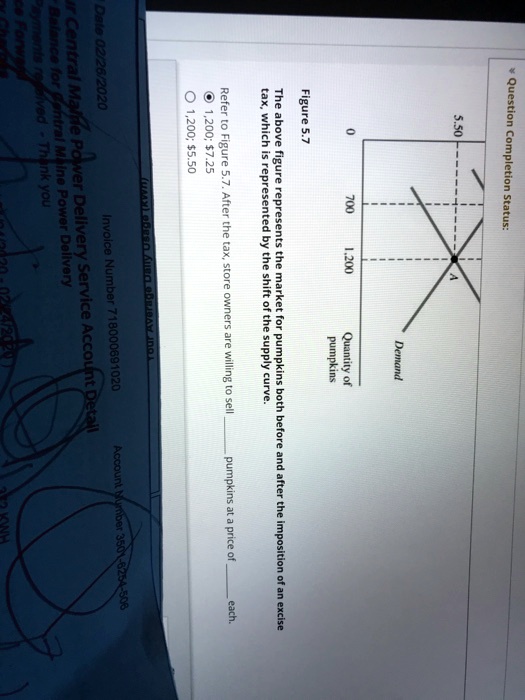
Figure 5.7
The above figure represents the market for pumpkins both before and after the imposition of an excise tax, which is represented by the shift of the supply curve.
Refer to Figure 5.7. After the tax, store owners are willing to sell pumpkins at a price of each.
1,200; $7.25
1,200; $5.50