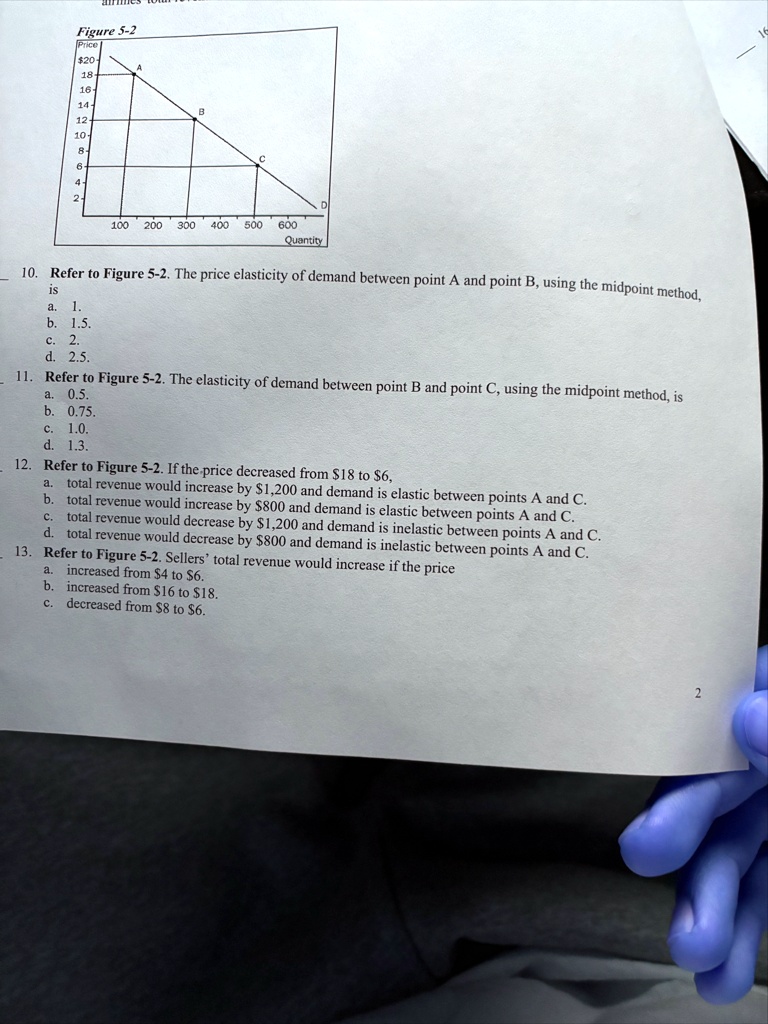
Figure 5-2
Price
$20-
18-
16-
12
10
100 200 300 400 500 600
Quantity
10. Refer to Figure 5-2. The price elasticity of demand between point A and point B, using the midpoint method,
is
a. 1.
b. 1.5.
c. 2.
d. 2.5.
11. Refer to Figure 5-2. The elasticity of demand between point B and point C, using the midpoint method, is
a. 0.5.
b. 0.75.
c. 1.0.
d. 1.3.
12. Refer to Figure 5-2. If the price decreased from $18 to $6,
a. total revenue would increase by $1,200 and demand is elastic between points A and C.
b. total revenue would increase by $800 and demand is elastic between points A and C.
c. total revenue would decrease by $1,200 and demand is inelastic between points A and C.
d. total revenue would decrease by $800 and demand is inelastic between points A and C.
13. Refer to Figure 5-2. Sellers' total revenue would increase if the price
a. increased from $4 to $6.
b. increased from $16 to $18.
c. decreased from $8 to $6.