Ace - AI Tutor
Ask Our Educators
Textbooks
My Library
Flashcards
Scribe - AI Notes
Notes & Exams
Download App
audrey guardia

audrey g.

Divider

Questions asked

BEST MATCH

Evaluate the integral. From 0 to t. 7 sin^2 (x) dx

View Answer
divider
BEST MATCH

Determine the KM and Vmax for an enzyme that yields the following kinetic data: KM = 55 mM; Vmax = 0.6 M/min KM = 0.01 mM ; Vmax = 55 mM/min KM = 0.5 mM; Vmax = 55 mM/min KM = 0.5 mM; Vmax = 25 mM/min

View Answer
divider
BEST MATCH

in deciding two 2014 cases involving the legality of searching a suspects cell phone, the supreme court rules that

View Answer
divider
BEST MATCH

39. What is the best coefficient of performance possible for a hypothetical refrigerator that could make liquid nitrogen at -200°C and has heat transfer to the environment at 35.0°C? 40. In a very mild winter climate, a heat pump has heat transfer from an environment at 5.00°C to one at 35.0°C. What is the best possible coefficient of performance for these temperatures? Explicitly show how

View Answer
divider
BEST MATCH

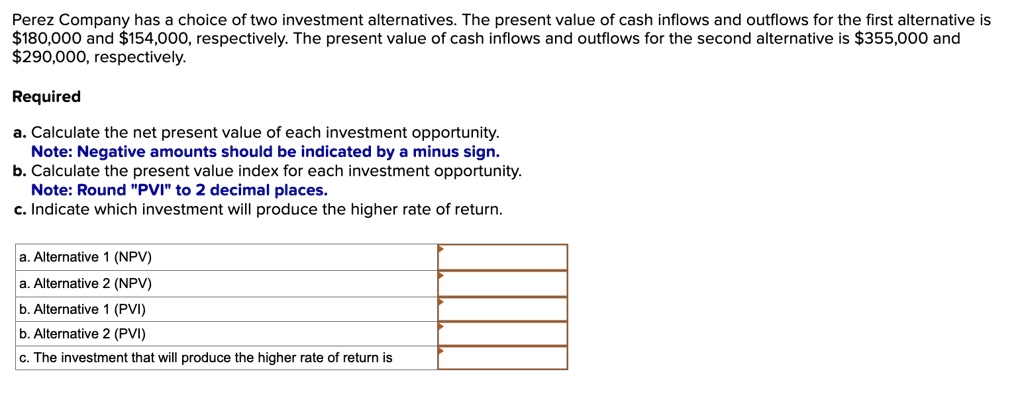
Perez Company has a choice of two investment alternatives. The present value of cash inflows and outflows for the first alternative is \$180,000 and \$154,000, respectively. The present value of cash inflows and outflows for the second alternative is \$355,000 and \$290,000, respectively. Required a. Calculate the net present value of each investment opportunity. Note: Negative amounts should be indicated by a minus sign. b. Calculate the present value index for each investment opportunity. Note: Round \"PVI\" to 2 decimal places. c. Indicate which investment will produce the higher rate of return. a. Alternative 1 (NPV) a. Alternative 2 (NPV) b. Alternative 1 (PVI) b. Alternative 2 (PVI) c. The investment that will produce the higher rate of return is
View Answer
divider
BEST MATCH

III. Given the graph, determine the following limits: (3pts) (a) $\lim_{x\to -5^+} f(x) = $ (b) $\lim_{x\to -5} f(x) = $ (c) $\lim_{x\to 1^-} f(x) = $ (d) $\lim_{x\to -\infty} f(x) = $ (e) $\lim_{x\to 3} f(x) = $ (f) $\lim_{x\to +\infty} f(x) = $

View Answer
divider
BEST MATCH

Jump to level 1 A local parks and recreation board is considering building a new set of bike trails. Before building new trails, they decide to look at how many riders are using an existing bike trail over a random sample of 90 days. Each day is rated as "high volume" or "low volume" (1 means yes, 0 means no). • The parks and recreation board believes that less than 30% of days are low volume. Complete the code to test this hypothesis using proportions_ztest(). The code provided loads the dataset and packages, calculates the number of low volume days, and prints the test statistic and p- value. main.py trails.csv 1 # Import packages and functions 2 import pandas as pd 3 from statsmodels.stats.proportion import proportions_ztest 4 5 # Load the dataset 6 trails = pd.read_csv('trails.csv') 7 8 x = trails['lowvolume'].value_counts() 9 n = trails.shape[0] 10 11 # Find the test statistic and p-value 12 test = proportions_ztest() 13 14 print('Test statistic:', test[0]) 15 print('p-value:', test[1])

View Answer
divider
BEST MATCH

2. Find the angle between the vectors $\vec{u} = \begin{bmatrix} 0 \\ 1 \\ 3 \\ -6 \end{bmatrix}$ and $\vec{v} = \begin{bmatrix} -1 \\ 1 \\ 2 \\ 2 \end{bmatrix}$ in $\mathbb{R}^4$ equipped with the inner product \$\langle \vec{x}, \vec{y} \rangle = x_1y_1 + 2x_2y_2 + 3x_3y_3 + 4x_4y_4$. \\ Also find $Proj_{\vec{v}}(\vec{u})$ and $Proj_{\vec{u}}(\vec{v})$ using the inner product $\langle \vec{x}, \vec{y} \rangle$ defined above.

View Answer
divider
BEST MATCH

FIGURE 19.1 The Lorenz Curve The Lorenz curve illustrates the extent of income inequality. If all incomes were equal, each fifth of the population would receive one- fith of total income. In this case, the diagonal line through point C would represent the cumulative size distribution of income. In reality, incomes aren't distributed equally. Point A, for example, indicates that the 20 percent of the population with the lowest income receive only 3.2 percent of total income. Source: Figure 2.3. CUMULATIVE PERCENTAGE OF INCOME Inequality gap Absolute equality 100 90 80 70 60 50 40 30 26.0 C 20 10 A 3.2 0 Actual distribution The Lorenz curve depicts the degree of inequality. 10 20 30 40 50 60 70 80 90 100 CUMULATIVE PERCENTAGE OF PEOPLE

View Answer
divider
BEST MATCH

1. Use Gauss-Seidel method to find the solution of the following equations $x_1 + x_1x_2 = 10$ $x_1 + x_2 = 6$ With the following estimates (a) $x_1^{(0)} = 1$ and $x_2^{(0)} = 1$ (b) $x_1^{(0)} = 1$ and $x_2^{(0)} = 2$ (c) Continue the iterations until $|\Delta x_1^{(k)}|$ and $|\Delta x_2^{(k)}|$ are less than 0.001.

View Answer
divider