can you solve it with minitab and make steps in the software because i want to know how
Goal:
Analysis of variance(ANOVA)to analyze and interpret the data
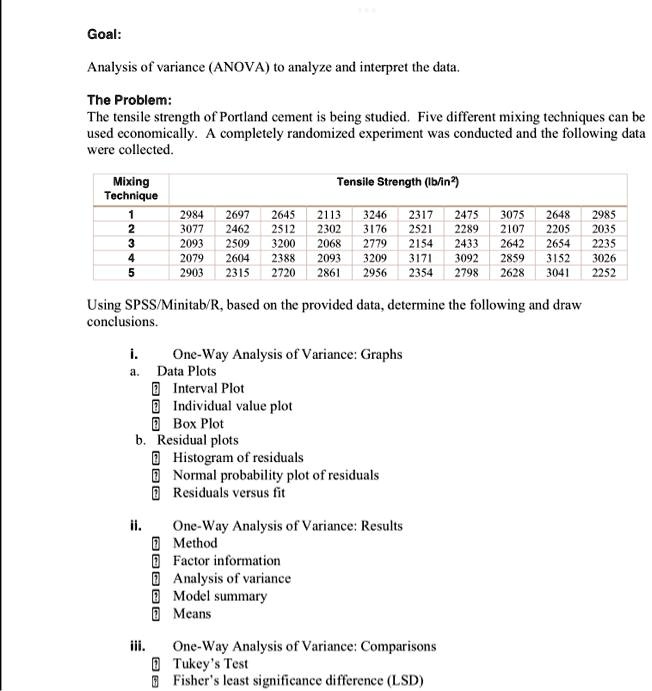
The Problem: The tensile strength of Portland cement is being studied. Five different mixing techniques can be used economically. A completely randomized experiment was conducted and the following data were collected
Mixing Tensile Strength (lb/in2) Technique 1 2984 2697 2645 2113 3246 2317 2475 2 3077 2462 2512 2302 3176 2521 2289 3 2093 2509 3200 2068 2779 2154 2433 4 2079 2604 2388 2093 3209 3171 3092 5 2903 2315 2720 2861 2956 2354 2798
3075 2648 2985 2107 2205 2035 2642 2654 2235 2859 3152 3026 2628 3041 2252
Using SPSS/Minitab/R,based on the provided data,determine the following and draw conclusions.
i. One-Way Analysis of Variance:Graphs a. Data Plots Interval Plot Individual value plot Box Plot b.Residual plots Histogram of residuals Normal probability plot of residuals Residuals versus fit
ii.
One-Way Analysis of Variance:Results
Factor information Analysis of variance Model summary Means
iii.
One-Way Analysis of Variance:Comparisons Tukey's Test Fisher's least significance difference LSD